swami_rsi
Description:
As in the practices, most traders find it hard to set the proper lookback period of the indicator to be used. SwamiCharts offers a comprehensive way to visualize the indicator used over a range of lookback periods. The SwamiCharts of Relative Strength Index (RSI), was developed by Ehlers - see Cycle Analytics for Traders, chapter 16. The indicator was computed over multiple times of the range of lookback period for the Relative Strength Index (RSI), from the deficient period to the relatively high lookback period i.e. 1 to 48, then plotted as one heatmap.
Features:
In this indicator, the improvement is to utilize the color(dot)rgb() function, which finds to giving a relatively lower time to compute, and follows the original color scheme.
The confirmation level, which assumed of 25
"Relative Strength Index (RSI) " için komut dosyalarını ara

QuickSilver Intraday using RSIThis is a simple intraday strategy using very basic intraday super indicators - RSI & VWAP for working on Stocks . You can modify the values on the stock and see what are your best picks. Comment below if you found something with good returns
Strategy:
Indicators used :
The Relative Strength Index (RSI) is one of the most popular and widely used momentum oscillators.The values of the RSI oscillator, typically measured over a 14-day period, fluctuate between zero and 100. The Relative Strength Index indicates oversold market conditions when below 30 and overbought market conditions when above 70
VWAP identifies the true average price of a stock by factoring the volume of transactions at a specific price point and not based on the closing price. VWAP can add more value than your standard 10, 50, or 200 moving average indicators because VWAP reacts to price movements based on the volume during a given period.
Buying happens at VWAP Breakouts which is then validated with RSI to check for overbought & oversold conditions.
Aggressive trade stop can be employed by using the % for long and shorts in the strategy.
Usage & Best setting :
Choose a good volatile stock and a time frame - 10m.
RSI : 9
Overbought & Oversold - can be varied as per user
There is stop loss and take profit that can be used to optimise your trade
Extending this to,
In general guidelines for RSI :
Short-term intraday traders (day trading) often use lower settings with periods in the range of 9-11.
Medium-term swing traders frequently use the default period setting of 14.
Longer-term position traders often set it at a higher period, in the range of 20-30.
The template also includes daily square off based on your time.

MSTY-WNTR Rebalancing SignalMSTY-WNTR Rebalancing Signal
## Overview
The **MSTY-WNTR Rebalancing Signal** is a custom TradingView indicator designed to help investors dynamically allocate between two YieldMax ETFs: **MSTY** (YieldMax MSTR Option Income Strategy ETF) and **WNTR** (YieldMax Short MSTR Option Income Strategy ETF). These ETFs are tied to MicroStrategy (MSTR) stock, which is heavily influenced by Bitcoin's price due to MSTR's significant Bitcoin holdings.
MSTY benefits from upward movements in MSTR (and thus Bitcoin) through a covered call strategy that generates income but caps upside potential. WNTR, on the other hand, provides inverse exposure, profiting from MSTR declines but losing in rallies. This indicator uses Bitcoin's momentum and MSTR's relative strength to signal when to hold MSTY (bullish phases), WNTR (bearish phases), or stay neutral, aiming to optimize returns by switching allocations at key turning points.
Inspired by strategies discussed in crypto communities (e.g., X posts analyzing MSTR-linked ETFs), this indicator promotes an active rebalancing approach over a "set and forget" buy-and-hold strategy. In simulated backtests over the past 12 months (as of August 4, 2025), the optimized version has shown potential to outperform holding 100% MSTY or 100% WNTR alone, with an illustrative APY of ~125% vs. ~6% for MSTY and ~-15% for WNTR in one scenario.
**Important Disclaimer**: This is not financial advice. Past performance does not guarantee future results. Always consult a financial advisor. Trading involves risk, and you could lose money. The indicator is for educational and informational purposes only.
## Key Features
- **Momentum-Based Signals**: Uses a Simple Moving Average (SMA) on Bitcoin's price to detect bullish (price > SMA) or bearish (price < SMA) trends.
- **RSI Confirmation**: Incorporates MSTR's Relative Strength Index (RSI) to filter signals, avoiding overbought conditions for MSTY and oversold for WNTR.
- **Visual Cues**:
- Green upward triangle for "Hold MSTY".
- Red downward triangle for "Hold WNTR".
- Yellow cross for "Switch" signals.
- Background color: Green for MSTY, red for WNTR.
- **Information Panel**: A table in the top-right corner displays real-time data: BTC Price, SMA value, MSTR RSI, and current Allocation (MSTY, WNTR, or Neutral).
- **Alerts**: Configurable alerts for holding MSTY, holding WNTR, or switching.
- **Optimized Parameters**: Defaults are tuned (SMA: 10 days, RSI: 15 periods, Overbought: 80, Oversold: 20) based on simulations to reduce whipsaws and capture trends effectively.
## How It Works
The indicator's logic is straightforward yet effective for volatile assets like Bitcoin and MSTR:
1. **Primary Trigger (Bitcoin Momentum)**:
- Calculate the SMA of Bitcoin's closing price (default: 10-day).
- Bullish: Current BTC price > SMA → Potential MSTY hold.
- Bearish: Current BTC price < SMA → Potential WNTR hold.
2. **Secondary Filter (MSTR RSI Confirmation)**:
- Compute RSI on MSTR stock (default: 15-period).
- For bullish signals: If RSI > Overbought (80), signal Neutral (avoid overextended rallies).
- For bearish signals: If RSI < Oversold (20), signal Neutral (avoid capitulation bottoms).
3. **Allocation Rules**:
- Hold 100% MSTY if bullish and not overbought.
- Hold 100% WNTR if bearish and not oversold.
- Neutral otherwise (e.g., during choppy or extreme markets) – consider holding cash or avoiding trades.
4. **Rebalancing**:
- Switch signals trigger when the hold changes (e.g., from MSTY to WNTR).
- Recommended frequency: Weekly reviews or on 5% BTC moves to minimize trading costs (aim for 4-6 trades/year).
This approach leverages Bitcoin's influence on MSTR while mitigating the risks of MSTY's covered call drag during downtrends and WNTR's losses in uptrends.
## Setup and Usage
1. **Chart Requirements**:
- Apply this indicator to a Bitcoin chart (e.g., BTCUSD on Binance or Coinbase, daily timeframe recommended).
- Ensure MSTR stock data is accessible (TradingView supports it natively).
2. **Adding to TradingView**:
- Open the Pine Editor.
- Paste the script code.
- Save and add to your chart.
- Customize inputs if needed (e.g., adjust SMA/RSI lengths for different timeframes).
3. **Interpretation**:
- **Green Background/Triangle**: Allocate 100% to MSTY – Bitcoin is in an uptrend, MSTR not overbought.
- **Red Background/Triangle**: Allocate 100% to WNTR – Bitcoin in downtrend, MSTR not oversold.
- **Yellow Switch Cross**: Rebalance your portfolio immediately.
- **Neutral (No Signal)**: Panel shows "Neutral" – Hold cash or previous position; reassess weekly.
- Monitor the panel for key metrics to validate signals manually.
4. **Backtesting and Strategy Integration**:
- Convert to a strategy script by changing `indicator()` to `strategy()` and adding entry/exit logic for automated testing.
- In simulations (e.g., using Python or TradingView's backtester), it has outperformed buy-and-hold in volatile markets by ~100-200% relative APY, but results vary.
- Factor in fees: ETF expense ratios (~0.99%), trading commissions (~$0.40/trade), and slippage.
5. **Risk Management**:
- Use with a diversified portfolio; never allocate more than you can afford to lose.
- Add stop-losses (e.g., 10% trailing) to protect against extreme moves.
- Rebalance sparingly to avoid over-trading in sideways markets.
- Dividends: Reinvest MSTY/WNTR payouts into the current hold for compounding.
## Performance Insights (Simulated as of August 4, 2025)
Based on synthetic backtests modeling the last 12 months:
- **Optimized Strategy APY**: ~125% (by timing switches effectively).
- **Hold 100% MSTY APY**: ~6% (gains from BTC rallies offset by downtrends).
- **Hold 100% WNTR APY**: ~-15% (losses in bull phases outweigh bear gains).
In one scenario with stronger volatility, the strategy achieved ~4533% APY vs. 10% for MSTY and -34% for WNTR, highlighting its potential in dynamic markets. However, these are illustrative; real results depend on actual BTC/MSTR movements. Test thoroughly on historical data.
## Limitations and Considerations
- **Data Dependency**: Relies on accurate BTC and MSTR data; delays or gaps can affect signals.
- **Market Risks**: Bitcoin's volatility can lead to false signals (whipsaws); the RSI filter helps but isn't perfect.
- **No Guarantees**: This indicator doesn't predict the future. MSTR's correlation to BTC may change (e.g., due to regulatory events).
- **Not for All Users**: Best for intermediate/advanced traders familiar with ETFs and crypto. Beginners should paper trade first.
- **Updates**: As of August 4, 2025, this is version 1.0. Future updates may include volume filters or EMA options.
If you find this indicator useful, consider leaving a like or comment on TradingView. Feedback welcome for improvements!

ATR, ADX, RSI TableATR, ADX & RSI Dashboard (Color-Coded)
Overview
This indicator provides a clean, all-in-one dashboard that displays the current values for three of the most popular technical indicators: Average True Range (ATR), Average Directional Index (ADX), and Relative Strength Index (RSI).
To make analysis faster and more intuitive, the values in the table are dynamically color-coded based on key thresholds. This allows you to get an immediate visual summary of market volatility, trend strength, and momentum without cluttering your main chart area.
Features
The indicator displays a simple table in the bottom-right corner of your chart with the following color logic:
ATR (Volatility): Measures the average volatility of an asset.
Green: Low Volatility (ATR is less than 3% of the current price).
Orange: Moderate Volatility (ATR is between 3% and 5%).
Red: High Volatility (ATR is greater than 5%).
ADX (Trend Strength): Measures the strength of the underlying trend, regardless of its direction.
Red: Weak or Non-Trending Market (ADX is below 20).
Orange: Developing or Neutral Trend (ADX is between 20 and 25).
Green: Strong Trend (ADX is above 25).
RSI (Momentum): Measures the speed and change of price movements to identify overbought or oversold conditions.
Green: Potentially Oversold (RSI is below 40).
Orange: Neutral/Normal Conditions (RSI is between 40 and 70).
Red: Potentially Overbought (RSI is above 70).
How to Use
This tool is perfect for traders who want a quick, at-a-glance understanding of the current market state. Instead of analyzing three separate indicators, you can use this dashboard to:
Quickly confirm if a strong trend is present before entering a trade.
Assess volatility to adjust your stop-loss and take-profit levels.
Instantly spot potential overbought or oversold conditions.
Customization
All input lengths for the ATR, ADX, and RSI are fully customizable in the indicator's settings menu, allowing you to tailor the calculations to your specific trading style and timeframe.

Stochastic RSI with MTF TableShort Description of the Script
The provided Pine Script indicator, titled "Stochastic RSI with MTF Table," calculates and displays the Stochastic RSI for the current timeframe and multiple other timeframes (5m, 15m, 30m, 60m, 240m, and daily). The Stochastic RSI is a momentum indicator that blends the Relative Strength Index (RSI) and Stochastic Oscillator to identify overbought and oversold conditions, as well as potential trend reversals via K and D line crossovers.
Key features of the script include:
Inputs: Customizable parameters such as K smoothing (default 3), D smoothing (default 3), RSI length (default 14), Stochastic length (default 14), source price (default close), and overbought/oversold levels (default 80/20).
MTF Table: A table displays the Stochastic RSI status for each timeframe:
"OB" (overbought) if K > 80, "OS" (oversold) if K < 20, or "N" (neutral) otherwise.
Crossovers: "K↑D" for bullish (K crosses above D) and "K↓D" for bearish (K crosses below D).
Visualization: Plots the K and D lines for the current timeframe, with horizontal lines at 80 (overbought), 50 (middle), and 20 (oversold), plus a background fill for clarity.
Table Position: Configurable to appear in one of four chart corners (default: top-right).
This indicator helps traders assess momentum across multiple timeframes simultaneously, aiding in the identification of trend strength and potential entry/exit points.
Trading Strategy with 50EMA and 200EMA for Highest Winning Rate
To create a strategy with the best probability of a high winning rate using the Stochastic RSI MTF indicator alongside the 50-period Exponential Moving Average (50EMA) and 200-period Exponential Moving Average (200EMA), we can combine trend identification with momentum-based entry timing. The 50EMA and 200EMA are widely used to determine medium- and long-term trends, while the Stochastic RSI MTF table provides multi-timeframe momentum signals. Here’s the strategy:
1. Determine the Overall Trend
Bullish Trend: The 50EMA is above the 200EMA on the current timeframe (e.g., daily or 60m chart). This suggests an uptrend, often associated with a "Golden Cross."
Bearish Trend: The 50EMA is below the 200EMA on the current timeframe. This indicates a downtrend, often linked to a "Death Cross."
Implementation: Plot the 50EMA and 200EMA on your chart and visually confirm their relative positions.
2. Identify Entry Signals Using the Stochastic RSI MTF Table
In a Bullish Trend (50EMA > 200EMA):
Look for timeframes in the MTF table showing:
Oversold (OS): K < 20, indicating a potential pullback in the uptrend where price may rebound.
Bullish Crossover (K↑D): K crosses above D, signaling rising momentum and a potential entry point.
Example: If the 60m and 240m timeframes show "OS" or "K↑D," this could be a buy signal.
In a Bearish Trend (50EMA < 200EMA):
Look for timeframes in the MTF table showing:
Overbought (OB): K > 80, suggesting a rally in the downtrend where price may reverse downward.
Bearish Crossover (K↓D): K crosses below D, indicating declining momentum and a potential short entry.
Example: If the 30m and daily timeframes show "OB" or "K↓D," this could be a sell/short signal.
Current Timeframe Check: Use the plotted K and D lines on your trading timeframe for precise entry timing (e.g., confirm a K↑D crossover on a 60m chart for a long trade).
3. Confirm Signals Across Multiple Timeframes
Strengthen the Signal: A higher winning rate is more likely when multiple timeframes align with the trend and signal. For instance:
Bullish trend + "OS" or "K↑D" on 60m, 240m, and daily = strong buy signal.
Bearish trend + "OB" or "K↓D" on 15m, 60m, and 240m = strong sell signal.
Prioritize Higher Timeframes: Signals from the 240m or daily timeframe carry more weight due to their indication of broader trends, increasing reliability.
4. Set Stop-Loss and Take-Profit Levels
Long Trades (Bullish):
Stop-Loss: Place below the most recent swing low or below the 50EMA, whichever is closer, to protect against trend reversals.
Take-Profit: Target a key resistance level or use a risk-reward ratio (e.g., 2:1 or 3:1) based on the stop-loss distance.
Short Trades (Bearish):
Stop-Loss: Place above the most recent swing high or above the 50EMA, whichever is closer.
Take-Profit: Target a key support level or apply a similar risk-reward ratio.
Trailing Stop Option: As the trend progresses, trail the stop below the 50EMA (for longs) or above it (for shorts) to lock in profits.
5. Risk Management
Position Sizing: Risk no more than 1-2% of your trading capital per trade to minimize losses from false signals.
Volatility Consideration: Adjust stop-loss distances and position sizes based on the asset’s volatility (e.g., wider stops for volatile stocks or crypto).
Avoid Overtrading: Wait for clear alignment between the EMA trend and MTF signals to avoid low-probability setups.
Example Scenario
Chart: 60-minute timeframe.
Trend: 50EMA > 200EMA (bullish).
MTF Table: 60m shows "OS," 240m shows "K↑D," and daily is "N."
Action: Enter a long position when the 60m K line crosses above D, confirming the table signal.
Stop-Loss: Below the recent 60m swing low (e.g., 2% below entry).
Take-Profit: At the next resistance level or a 3:1 reward-to-risk ratio.
Outcome: High probability of success due to trend alignment and multi-timeframe confirmation.
Why This Strategy Works
Trend Following: Trading in the direction of the 50EMA/200EMA trend reduces the risk of fighting the market’s momentum.
Momentum Timing: The Stochastic RSI MTF table pinpoints pullbacks or reversals within the trend, improving entry timing.
Multi-Timeframe Confirmation: Alignment across timeframes filters out noise, increasing the win rate.
Risk Control: Defined stop-loss and position sizing protect against inevitable losses.
Caveats
No strategy guarantees a 100% win rate; false signals can occur, especially in choppy markets.
Test this strategy on historical data or a demo account to verify its effectiveness for your asset and timeframe.
This approach leverages the strengths of both trend-following (EMA) and momentum (Stochastic RSI) tools, aiming for a high-probability, disciplined trading system.

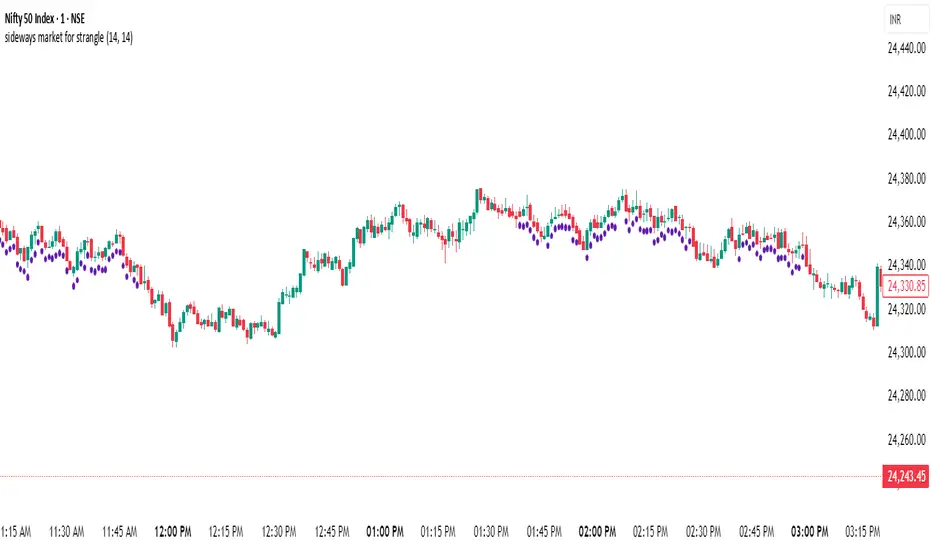
sideways market for strangleThis Pine Script is designed to identify **sideways or range-bound markets**, which are often ideal conditions for trading **options strangle strategies**. Here's a breakdown of what the script does:
---
### 🛠 **Purpose:**
To **detect low-volatility, sideways market conditions** where price is not trending strongly in either direction — suitable for **neutral options strategies like short strangles**.
---
### 📌 **Key Components:**
#### 1. **Inputs:**
- `RSI Length`: Default 14 — used for calculating the Relative Strength Index (RSI).
- `ADX Length`: Default 14 — used for calculating the Average Directional Index (ADX), DI+ (positive directional movement), and DI- (negative directional movement).
#### 2. **RSI Calculation:**
- `rsiValue` is calculated using the built-in `ta.rsi(close, rsiLength)`.
- A **sideways market** is expected when RSI is in the **40–60 range**, indicating lack of strong momentum.
#### 3. **ADX and Directional Indicators (DI+ and DI-):**
- `diPlus` and `diMinus` are calculated based on recent price movements and the True Range.
- `dx` (Directional Index) measures the strength of trend direction using the difference between DI+ and DI-.
- `adx` is a smoothed version of `dx` and represents **overall trend strength**.
#### 4. **Sideways Market Conditions:**
- **RSI Condition**: RSI is between 40 and 60.
- **ADX Condition**:
- `adx <= 25` → Weak or no trend.
- `adx < diPlus` and `adx < diMinus` → Confirms ADX is lower than directional components, reducing likelihood of a trending market.
#### 5. **Signal Plot:**
- A **green label below the bar** (`shape.labelup`) is plotted when both conditions are met.
- Indicates potential sideways market conditions.
---
### ✅ **Use Case:**
- This signal can help identify **low-volatility zones** suitable for **short strangles** or **iron condors**, where you profit from time decay while expecting the price to stay within a range.
RSI+Stoch Band Oscillator📈 RSI + Stochastic Band Oscillator
Overview:
The RSI + Stochastic Band Oscillator is a technical indicator that combines the strengths of both the Relative Strength Index (RSI) and the Stochastic Oscillator. Instead of using static thresholds, this indicator dynamically constructs upper and lower bands based on the RSI and Stochastic overbought/oversold zones. It then measures the relative position of the current price within this adaptive range, effectively producing a normalized oscillator.
Key Components:
RSI-Based Dynamic Bands:
Using RSI values and exponential moving averages of price changes, upper and lower dynamic bands are constructed.
These bands adjust based on overbought and oversold levels, offering a more responsive framework than fixed RSI thresholds.
Stochastic-Based Dynamic Bands:
Similarly, Stochastic %K and %D values are used to construct dynamic bands.
These adapt to overbought and oversold levels by recalculating potential high/low values within the lookback window.
Oscillator Calculation:
The oscillator (osc) is computed as the relative position of the current close within the combined upper and lower bands of both RSI and Stochastic.
This value is normalized between 0 and 100, allowing clear identification of extreme conditions.
Visual Features:
The oscillator is plotted as a line between 0 and 100.
Color-filled areas highlight when the oscillator enters extreme zones:
Above 100 with falling momentum: Red zone (potential reversal).
Below 0 with rising momentum: Green zone (potential reversal).
Additional trend conditions (falling/rising RSI, %K, and %D) are used to strengthen reversal signals by confirming momentum shifts.

alphaJohnny Dynamic RSI IndicatorAlphaJohnny Dynamic RSI Indicator (Dyn RSI)
The Dynamic RSI Indicator (Dyn RSI) is a custom Pine Script tool designed for TradingView that aggregates Relative Strength Index (RSI) signals from multiple timeframes to provide a comprehensive view of market momentum. It combines RSI data from Weekly, Daily, 4-hour, 1-hour, and 30-minute intervals, offering traders a flexible and customizable way to analyze trends across different periods.
Key Features:
Multi-Timeframe RSI Aggregation: Combines RSI signals from user-selected timeframes for a holistic momentum assessment.
Dynamic or Equal Weighting: Choose between correlation-based dynamic weights (adjusting based on each timeframe’s correlation with price changes) or equal weights for simplicity.
Smoothed Momentum Line: A visually intuitive line that reflects the strength of the aggregate signal, smoothed for clarity.
Color-Coded Signal Strength:
Dark Green: Strong buy signal
Light Green: Weak buy signal
Yellow: Neutral
Light Red: Weak sell signal
Dark Red: Strong sell signal
Visual Markers: Large green triangles at the bottom for strong buy signals and red triangles at the top for strong sell signals.
How to Use:
Apply to Chart: Add the indicator to your TradingView chart (it will appear in a separate pane).
Customize Settings: Adjust inputs like RSI period, signal thresholds, included timeframes, weighting method, and smoothing period to fit your trading style.
Interpret Signals:
Momentum Line: Watch for color changes to gauge market conditions.
Triangles: Green at the bottom for strong buy opportunities, red at the top for strong sell opportunities.
Notes:
The indicator is designed for a separate pane (overlay=false), with triangles positioned relative to the pane’s range.
Fine-tune thresholds and weights based on your strategy and the asset being analyzed.
The source code is open for modification to suit your needs.
This indicator is ideal for traders seeking a multi-timeframe perspective on RSI to identify potential trend reversals and momentum shifts.

XAUUSD Trend Strategy### Description of the XAUUSD Trading Strategy with Pine Script
This strategy is designed to trade gold (**XAUUSD**) using proven technical analysis principles. It combines key indicators such as **Exponential Moving Averages (EMA)**, the **Relative Strength Index (RSI)**, and **Bollinger Bands** to identify trading opportunities in trending market conditions.
---
#### Objective:
To maximize profits by identifying trend-aligned entry points while minimizing risks through well-defined Stop Loss and Take Profit levels.
---
### How It Works
1. **Indicators Used:**
- **Exponential Moving Averages (EMA):** Tracks short-term and long-term trends to confirm market direction.
- **Relative Strength Index (RSI):** Detects overbought or oversold conditions for potential reversals or trend continuation.
- **Bollinger Bands:** Measures volatility to identify breakout or reversion points.
2. **Entry Rules:**
- **Long (Buy):** Triggered when:
- The short-term EMA crosses above the long-term EMA (bullish trend confirmation).
- RSI exits oversold territory (<30), signaling buying momentum.
- The price breaks above the upper Bollinger Band, indicating a strong trend.
- **Short (Sell):** Triggered when:
- The short-term EMA crosses below the long-term EMA (bearish trend confirmation).
- RSI exits overbought territory (>70), signaling selling momentum.
- The price breaks below the lower Bollinger Band, indicating a strong downtrend.
3. **Risk Management:**
- **Stop Loss:** Automatically calculated based on a percentage of equity risk (customizable via inputs).
- **Take Profit:** Defined using a risk-to-reward ratio, ensuring consistent profitability when trades succeed.
4. **Visualization:**
- The chart displays the EMAs, Bollinger Bands, and entry/exit points for clear analysis.
---
### Key Features:
- **Customizable Parameters:** You can adjust EMAs, RSI thresholds, Bollinger Band settings, and risk levels to suit your trading style.
- **Alerts:** Automatic alerts for potential trade setups.
- **Backtesting-Ready:** Easily test historical performance on TradingView.
---
This strategy is ideal for gold traders looking for a systematic, rule-based approach to trading trends with minimal emotional interference.

Mars Signals - SSL Trend AnalyzerIntroduction
The "Mars Signals - Precision Trend Analyzer with SSL Baseline & Price Action Zones" is a comprehensive technical analysis tool designed for traders seeking to enhance their market analysis and trading strategies. This indicator integrates multiple advanced trading concepts, including dynamic moving averages, trend detection algorithms, momentum indicators, volume analysis, higher timeframe confirmation, candlestick pattern recognition, and precise price action zones. By combining these elements, the indicator aims to provide clear and actionable buy and sell signals, helping traders to make informed decisions in various market conditions.
Core Components and Functionality
1.Dynamic Baseline Calculation
Moving Average Types: The indicator allows users to select from a variety of moving average types for the baseline calculation, including Simple Moving Average (SMA), Exponential Moving Average (EMA), Hull Moving Average (HMA), Weighted Moving Average (WMA), Double EMA (DEMA), Triple EMA (TEMA), Least Squares Moving Average (LSMA), Triangular Moving Average (TMA), Kijun (from Ichimoku Kinko Hyo), and McGinley's Dynamic.
Baseline Length: Users can customize the length of the moving average, providing flexibility to adjust the sensitivity of the baseline to market movements.
Signal Line Generation: The indicator computes a dynamic signal line based on the relationship between the close price and the moving averages of the high and low prices. This signal line adapts to market volatility and trend changes.
2.SSL Baseline Integration
SSL Baseline: In addition to the primary baseline, the indicator incorporates an SSL (Semaphore Signal Level) Baseline, which further refines trend detection by considering the highs and lows over a specified period.
Dual Confirmation: The combination of the primary baseline and the SSL baseline enhances the reliability of the trend signals by requiring agreement between both baselines before generating a signal.
3.Momentum and Trend Filters
Relative Strength Index (RSI): The indicator uses the RSI to assess the momentum of price movements, filtering out signals that occur during overbought or oversold conditions.
Moving Average Convergence Divergence (MACD): The MACD is employed to identify the direction and strength of the trend, adding another layer of confirmation to the signals.
Average Directional Index (ADX): The ADX measures the strength of the trend, ensuring that signals are generated only when the market shows significant directional movement.
4.Volume Analysis
Volume Filter: An optional volume filter compares the current volume to its moving average, allowing traders to focus on signals that occur during periods of higher market activity.
5.Higher Timeframe Confirmation
Multi-Timeframe Analysis: The indicator can incorporate data from a higher timeframe, comparing the current price to the higher timeframe's baseline and signal line. This feature helps traders align their trades with the broader market trend.
6.Candlestick Pattern Recognition
Bullish Patterns: The indicator detects bullish patterns such as Bullish Engulfing, Piercing Line, Hammer, and Doji.
Bearish Patterns: It also identifies bearish patterns like Bearish Engulfing, Dark Cloud Cover, Shooting Star, and Doji.
Pattern Prioritization: The patterns are prioritized to highlight the most significant formations, which can serve as additional confirmation for trade entries and exits.
7.Price Action Zones
Support and Resistance Levels: The indicator automatically identifies pivot highs and lows to establish dynamic support and resistance levels.
Zone Visualization: It draws shaded rectangles on the chart to represent these zones, providing a clear visual aid for potential reversal or breakout areas.
ATR-Based Zone Width: The zones' thickness is dynamically calculated using the Average True Range (ATR), adjusting to the current market volatility.
Background Coloring: The chart background changes color when the price is above the maximum resistance or below the minimum support, alerting traders to significant price movements.
Interpreting the Signals
1.Buy Signals
Conditions:
Price crosses above the signal line.
RSI is below 70 (not overbought).
MACD line is above the signal line (indicating bullish momentum).
ADX is above the user-defined threshold (default is 20), confirming a strong trend.
(Optional) Volume is above its moving average if the volume filter is enabled.
(Optional) Price is above the higher timeframe baseline and signal line if the higher timeframe filter is enabled.
(Optional) A bullish candlestick pattern is detected if the candlestick pattern filter is enabled.
Visual Indicators:
An upward-pointing label with the text "BUY" appears below the price bar.
The baseline and SSL baseline lines turn to colors indicating bullish conditions.
2.Sell Signals
Conditions:
Price crosses below the signal line.
RSI is above 30 (not oversold).
MACD line is below the signal line (indicating bearish momentum).
ADX is above the user-defined threshold, confirming a strong trend.
(Optional) Volume is above its moving average if the volume filter is enabled.
(Optional) Price is below the higher timeframe baseline and signal line if the higher timeframe filter is enabled.
(Optional) A bearish candlestick pattern is detected if the candlestick pattern filter is enabled.
Visual Indicators:
A downward-pointing label with the text "SELL" appears above the price bar.
The baseline and SSL baseline lines turn to colors indicating bearish conditions.
3.Support and Resistance Zones
Interpretation:
Resistance Zones: Represent areas where the price may face selling pressure. A break above these zones can signal a strong bullish move.
Support Zones: Represent areas where the price may find buying interest. A break below these zones can signal a strong bearish move.
Background Color:
The background turns red when the price is above the maximum resistance, indicating potential overextension.
The background turns green when the price is below the minimum support, indicating potential undervaluation.
Effective Usage Strategies
1.Customization
Adjusting Baseline and SSL Settings: Traders should experiment with different moving average types and lengths to match their trading style and the specific characteristics of the asset being analyzed.
Filtering Parameters: Modify RSI, MACD, and ADX settings to fine-tune the sensitivity of the signals.
Volume and Higher Timeframe Filters: Enable these filters to add robustness to the signals, especially in volatile markets or when trading higher timeframes.
2.Combining with Other Analysis
Fundamental Analysis: Use the indicator in conjunction with fundamental insights to validate technical signals.
Risk Management: Always apply proper risk management techniques, such as setting stop-loss and take-profit levels based on the support and resistance zones provided by the indicator.
3.Backtesting
Historical Analysis: Utilize the indicator's settings to backtest trading strategies on historical data, helping to identify the most effective configurations before applying them in live trading.
4.Monitoring Market Conditions
Volatility Awareness: Pay attention to the ATR and ADX readings to understand market volatility and trend strength, adjusting strategies accordingly.
Event Considerations: Be cautious around major economic announcements or events that may impact market behavior beyond technical indications.
Indicator Inputs and Customization Options
Baseline Type and Length: Select from multiple moving average types and specify the period length.
ADX Settings: Adjust the length, smoothing, and threshold for trend strength confirmation.
Volume Filter: Enable or disable the volume confirmation filter.
Higher Timeframe Filter: Choose to incorporate higher timeframe analysis and specify the desired timeframe.
Candlestick Patterns: Enable or disable the detection of candlestick patterns for additional signal confirmation.
SSL Baseline Type and Length: Customize the SSL baseline settings separately from the primary baseline.
Price Action Zones Settings:
Zone Thickness: Adjust the visual thickness of the support and resistance zones.
Lookback Period: Define how far back the indicator looks for pivot points.
ATR Multiplier for Zone Width: Set the multiplier for ATR to determine the dynamic width of the zones.
Maximum Number of Zones: Limit the number of support and resistance zones displayed.
Pivot Bars: Customize the number of bars to the left and right used for identifying pivot highs and lows.
Conclusion
The "Mars Signals - Precision Trend Analyzer with SSL Baseline & Price Action Zones" is a versatile and powerful tool that amalgamates essential technical analysis techniques into a single, user-friendly indicator. By providing clear visual signals and incorporating multiple layers of confirmation, it assists traders in identifying high-probability trading opportunities. Whether you are a day trader, swing trader, or long-term investor, this indicator can be tailored to suit your trading style and enhance your decision-making process.
To maximize the benefits of this indicator:
Understand Each Component: Familiarize yourself with how each part of the indicator contributes to the overall signal generation.
Customize Thoughtfully: Adjust the settings based on the asset class, market conditions, and your risk tolerance.
Practice Diligently: Use demo accounts or paper trading to practice and refine your strategy before deploying it in live markets.
Stay Informed: Continuously educate yourself on technical analysis and market dynamics to make the most informed decisions.
Disclaimer
Trading financial markets involves risk, and past performance is not indicative of future results. This indicator is a tool to aid in analysis and should not be the sole basis for any trading decision. Always conduct your own research and consider consulting with a licensed financial advisor.

41-80 F&O MA ScreenerThis Pine Script is a TradingView indicator named "41-80-F&O EMA Screener." It calculates and displays four moving averages (MA1, MA2, MA3, and MA4) and the Relative Strength Index (RSI) on a chart. The script generates buy and short signals based on certain conditions involving the moving averages and RSI. Additionally, it includes a screener section that displays a table of symbols with buy and short signals.
Here's a breakdown of the key components:
Moving Averages (MAs):
MA1: Simple Moving Average with length len1 (green line).
MA2: Simple Moving Average with length len2 (red line).
MA3: Simple Moving Average with length len3 (orange line).
MA4: Simple Moving Average with length len4 (black line).
Relative Strength Index (RSI):
The RSI is calculated with a length of rsiLengthInput and a source specified by rsiSourceInput.
Conditions for Buy and Short Signals:
Buy Signal: When MA1 is above MA2 and MA3, and RSI is above 50.
Short Signal: When MA1 is below MA2 and MA3, and RSI is below 50.
Signal Plots:
Buy signals are plotted as "B" below the corresponding bars.
Short signals are plotted as "S" above the corresponding bars.
Background Coloring:
Bars are colored based on their opening and closing prices.
Screener Section:
The script defines a watchlist (gticker) with 40 predefined symbols.
It then calls the getSignal function for each symbol to identify buy and short signals.
The results are displayed in a table with long signals in green and short signals in red.
Table Theming:
The script allows customization of the table's background, frame, and text colors, as well as the text size.
The table's location on the chart can also be customized.
Please note that the script uses the Mozilla Public License 2.0. Make sure to review and comply with the terms of this license if you plan to use or modify the script.
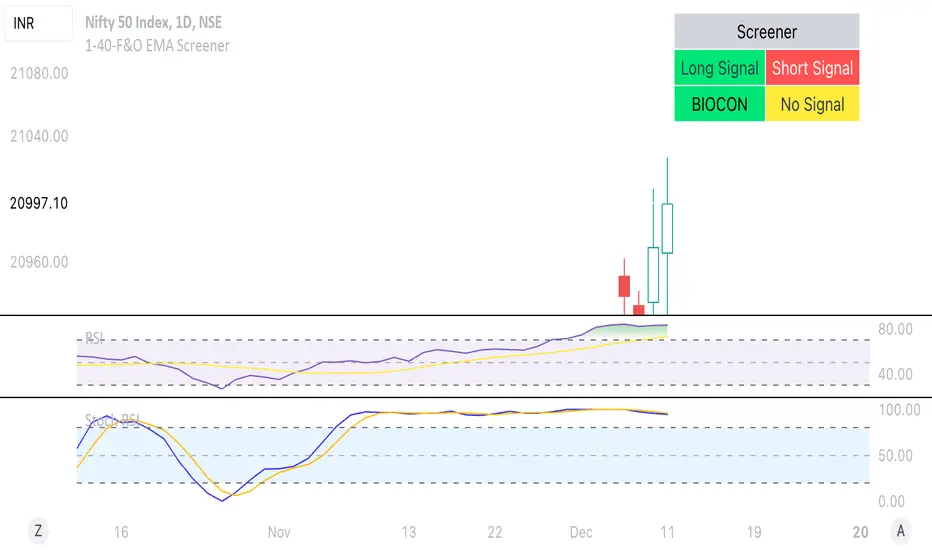
1-40-F&O EMA ScreenerThis Pine Script is a TradingView indicator named "1-40-F&O EMA Screener." It calculates and displays four moving averages (MA1, MA2, MA3, and MA4) and the Relative Strength Index (RSI) on a chart. The script generates buy and short signals based on certain conditions involving the moving averages and RSI. Additionally, it includes a screener section that displays a table of symbols with buy and short signals.
Here's a breakdown of the key components:
Moving Averages (MAs):
MA1: Simple Moving Average with length len1 (green line).
MA2: Simple Moving Average with length len2 (red line).
MA3: Simple Moving Average with length len3 (orange line).
MA4: Simple Moving Average with length len4 (black line).
Relative Strength Index (RSI):
The RSI is calculated with a length of rsiLengthInput and a source specified by rsiSourceInput.
Conditions for Buy and Short Signals:
Buy Signal: When MA1 is above MA2 and MA3, and RSI is above 50.
Short Signal: When MA1 is below MA2 and MA3, and RSI is below 50.
Signal Plots:
Buy signals are plotted as "B" below the corresponding bars.
Short signals are plotted as "S" above the corresponding bars.
Background Coloring:
Bars are colored based on their opening and closing prices.
Screener Section:
The script defines a watchlist (gticker) with 40 predefined symbols.
It then calls the getSignal function for each symbol to identify buy and short signals.
The results are displayed in a table with long signals in green and short signals in red.
Table Theming:
The script allows customization of the table's background, frame, and text colors, as well as the text size.
The table's location on the chart can also be customized.
Mike's Crossover BotGreetings! As a newcomer to coding, I've developed a simple trading bot for experimentation purposes. However, it's important to note that this bot has not undergone rigorous testing, so please exercise caution and use it at your own risk.
Bot Overview:
The bot operates by leveraging two technical indicators: Moving Average Convergence Divergence (MACD) with 7-day and 25-day parameters, and the Relative Strength Index (RSI). These indicators help identify potential buying and selling opportunities in the market.
MACD Crossovers:
The MACD is a trend-following momentum indicator that compares short-term and long-term moving averages. In our bot, we look for crossovers between the 7-day and 25-day MACD lines. A crossover occurs when these lines intersect, suggesting a potential change in market direction.
RSI Confirmation:
To refine our signals, we incorporate the Relative Strength Index (RSI). When a MACD crossover happens, the bot checks if the RSI is below 40. If it is, a buy signal is generated, indicating a potential undervalued condition. Conversely, when the RSI is above 60 during a crossover, a sell signal is triggered, suggesting a potentially overvalued condition.
Important Considerations:
New Coder Disclaimer: This bot is designed for educational purposes, especially for those who are new to coding. It serves as a learning tool and is not intended for live trading without proper testing.
Risk Awareness: Trading always involves risks, and the bot's performance has not been thoroughly tested in live market conditions. It's crucial to exercise caution and be aware of the inherent risks associated with financial markets.
Continuous Learning: Coding and algorithmic trading are dynamic fields. As you explore this bot, consider it a starting point for learning and continuously seek to enhance your understanding and skills in coding and trading strategies.
Remember, the success of any trading strategy depends on various factors, and past performance is not indicative of future results. Always conduct thorough testing before considering any automated strategy for live trading.

Perfect RSIOverview:
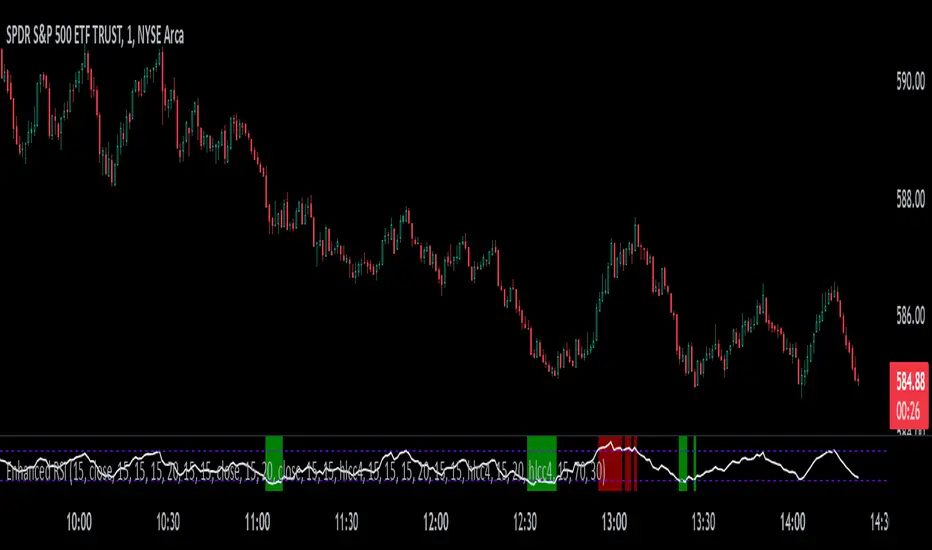
The "Enhanced RSI" is a comprehensive TradingView indicator designed to provide traders with a nuanced and detailed analysis of market conditions using the Relative Strength Index (RSI). It amalgamates various RSI calculation methods to offer a more robust and adaptable approach to technical analysis.
Originality:
This script is unique in its synthesis of multiple RSI calculation techniques, including Regular RSI, Dynamic RSI, DMI RSI, Wilder's RSI, TSI RSI, Momentum RSI, and PPO RSI. By combining these methods, the script creates a distinctive and versatile tool for traders seeking a holistic view of RSI dynamics.
How It Works:
Diverse RSI Calculations:
Regular RSI: Calculates standard RSI with user-defined length and source.
Dynamic RSI: Adjusts RSI dynamically based on price movement direction.
DMI RSI: Uses Directional Movement Index for RSI calculation.
Wilder's RSI: Implements Wilder's smoothing technique for RSI.
TSI RSI: Utilizes True Strength Index for RSI calculation.
Momentum RSI: Calculates RSI based on momentum.
PPO RSI: Applies Percentage Price Oscillator for RSI calculation.
Composite RSI:
Combines the individual RSIs into three composite indices (RSI1, RSI2, RSI) using a weighted average approach.
Dynamic Level Adjustment:
Uses the correlation coefficient to dynamically adjust overbought and oversold levels, enhancing adaptability to market changes.
Visualization and Background Coloring:
Visualizes overbought and oversold zones on the chart.
Adjusts background color based on these conditions for clearer interpretation.
How to Use:
Installation:
Copy and paste the script into the Pine Editor on TradingView.
Adjust parameters as needed.
Analysis:
Utilize the "Enhanced RSI" as a comprehensive analysis tool for RSI dynamics.
Consider it as a confirmation tool alongside other technical indicators.
Customization:
Experiment with different RSI lengths and methods to align with your trading strategy.
Backtest the script to validate its effectiveness.
Considerations:
Complexity:
The script is sophisticated; users are advised to understand each calculation method before reliance.
Parameter Sensitivity:
Effectiveness may vary based on chosen parameters; thorough backtesting and parameter optimization are recommended.
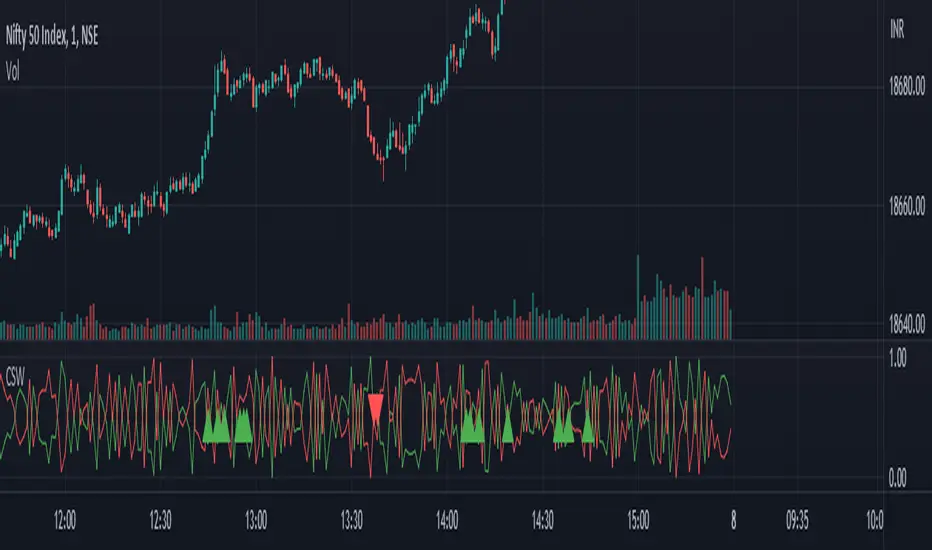
Candlestick Strength and Weakness with RSI and OBVThe "Candlestick Strength and Weakness with RSI and OBV" indicator, denoted as CSW, is a tool designed to assist traders in identifying potential trend reversals in financial markets. The CSW indicator combines the analysis of candlestick patterns, relative strength index (RSI), and on-balance volume (OBV) to provide traders with valuable insights into market dynamics.
The CSW indicator calculates the strength and weakness of each candlestick based on its open, close, high, and low prices. It considers the body range, upper shadow range, and lower shadow range of the candlestick to determine the distribution of strength and weakness within it. By quantifying the candlestick's strength and weakness, the indicator provides a visual representation of the balance between bullish and bearish forces in the market.
In addition to candlestick analysis, the CSW indicator incorporates RSI and OBV calculations to further validate potential trend reversals. The RSI is a widely-used momentum oscillator that measures the speed and change of price movements. The OBV, on the other hand, tracks the cumulative volume flow and helps identify periods of accumulation or distribution. By considering these indicators alongside candlestick strength and weakness, the CSW indicator enhances the accuracy of its signals.
To interpret the CSW indicator effectively, traders should consider the following:
Candlestick Strength and Weakness: The indicator plots two lines, "Candle Strength" and "Candle Weakness," representing the strength and weakness of each candlestick. The strength line indicates the bullish pressure, while the weakness line represents the bearish pressure.
Potential Reversal Signals: The CSW indicator identifies potential trend reversals based on the balance between candlestick strength and weakness, RSI readings, and OBV values. A bullish reversal signal occurs when the strength is higher than weakness, the RSI is below 30 (indicating oversold conditions), and the OBV is below its 20-period simple moving average (SMA). Conversely, a bearish reversal signal occurs when the weakness is higher than strength, the RSI is above 70 (indicating overbought conditions), and the OBV is above its 20-period SMA.
Trend Confirmation: The CSW indicator provides additional confirmation by comparing the closing price with the 20-period exponential moving average (EMA). If the closing price is above the EMA, it suggests an uptrend, while a closing price below the EMA indicates a downtrend.
Traders can add the indicator to their charts and customize its parameters based on their preferences. By monitoring the indicator's plots and observing the occurrence of potential reversal signals in alignment with the trend confirmation, traders can make informed decisions regarding entry or exit points in their trading strategies.
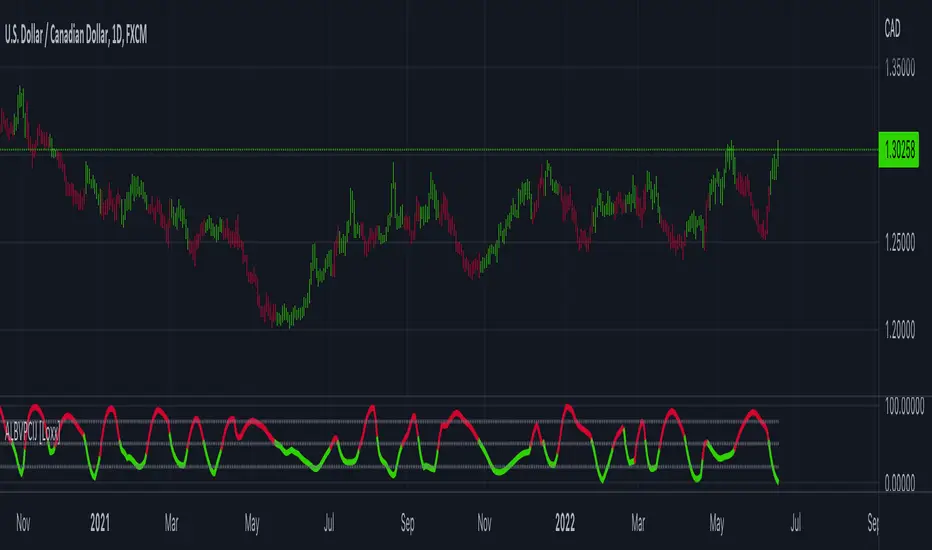
Adaptive Look-back/Volatility Phase Change Index on Jurik [Loxx]Adaptive Look-back, Adaptive Volatility Phase Change Index on Jurik is a Phase Change Index but with adaptive length and volatility inputs to reduce phase change noise and better identify trends. This is an invese indicator which means that small values on the oscillator indicate bullish sentiment and higher values on the oscillator indicate bearish sentiment
What is the Phase Change Index?
Based on the M.H. Pee's TASC article "Phase Change Index".
Prices at any time can be up, down, or unchanged. A period where market prices remain relatively unchanged is referred to as a consolidation. A period that witnesses relatively higher prices is referred to as an uptrend, while a period of relatively lower prices is called a downtrend.
The Phase Change Index (PCI) is an indicator designed specifically to detect changes in market phases.
This indicator is made as he describes it with one deviation: if we follow his formula to the letter then the "trend" is inverted to the actual market trend. Because of that an option to display inverted (and more logical) values is added.
What is the Jurik Moving Average?
Have you noticed how moving averages add some lag (delay) to your signals? ... especially when price gaps up or down in a big move, and you are waiting for your moving average to catch up? Wait no more! JMA eliminates this problem forever and gives you the best of both worlds: low lag and smooth lines.
Ideally, you would like a filtered signal to be both smooth and lag-free. Lag causes delays in your trades, and increasing lag in your indicators typically result in lower profits. In other words, late comers get what's left on the table after the feast has already begun.
That's why investors, banks and institutions worldwide ask for the Jurik Research Moving Average ( JMA ). You may apply it just as you would any other popular moving average. However, JMA's improved timing and smoothness will astound you.
What is adaptive Jurik volatility
One of the lesser known qualities of Juirk smoothing is that the Jurik smoothing process is adaptive. "Jurik Volty" (a sort of market volatility ) is what makes Jurik smoothing adaptive. The Jurik Volty calculation can be used as both a standalone indicator and to smooth other indicators that you wish to make adaptive.
What is an adaptive cycle, and what is Ehlers Autocorrelation Periodogram Algorithm?
From his Ehlers' book Cycle Analytics for Traders Advanced Technical Trading Concepts by John F. Ehlers, 2013, page 135:
"Adaptive filters can have several different meanings. For example, Perry Kaufman’s adaptive moving average (KAMA) and Tushar Chande’s variable index dynamic average (VIDYA) adapt to changes in volatility. By definition, these filters are reactive to price changes, and therefore they close the barn door after the horse is gone.The adaptive filters discussed in this chapter are the familiar Stochastic, relative strength index (RSI), commodity channel index (CCI), and band-pass filter.The key parameter in each case is the look-back period used to calculate the indicator. This look-back period is commonly a fixed value. However, since the measured cycle period is changing, it makes sense to adapt these indicators to the measured cycle period. When tradable market cycles are observed, they tend to persist for a short while.Therefore, by tuning the indicators to the measure cycle period they are optimized for current conditions and can even have predictive characteristics.
The dominant cycle period is measured using the Autocorrelation Periodogram Algorithm. That dominant cycle dynamically sets the look-back period for the indicators. I employ my own streamlined computation for the indicators that provide smoother and easier to interpret outputs than traditional methods. Further, the indicator codes have been modified to remove the effects of spectral dilation.This basically creates a whole new set of indicators for your trading arsenal."
Included
-Your choice of length input calculation, either fixed or adaptive cycle
-Invert the signal to match the trend
-Bar coloring to paint the trend
Happy trading!
DMI RSI AO 3 indicators in 1 overlayThis is simple indicators that plot 3 indicators DMI, RSI and AO on 1 pane
How to use: you can add on your chart and edit color and display in setting page of indicators
The directional movement index (DMI) is an indicator developed by J. Welles Wilder in 1978 that identifies in which direction the price of an asset is moving. The indicator does this by comparing prior highs and lows and drawing two lines: a positive directional movement line (+DI) and a negative directional movement line (-DI). An optional third line, called the average directional index (ADX), can also be used to gauge the strength of the uptrend or downtrend.
When +DI is above -DI, there is more upward pressure than downward pressure in the price. Conversely, if -DI is above +DI, then there is more downward pressure on the price. This indicator may help traders assess the trend direction. Crossovers between the lines are also sometimes used as trade signals to buy or sell.
The relative strength index (RSI) is a momentum indicator used in technical analysis that measures the magnitude of recent price changes to evaluate overbought or oversold conditions in the price of a stock or other asset. The RSI is displayed as an oscillator (a line graph that moves between two extremes) and can have a reading from 0 to 100. The indicator was originally developed by J. Welles Wilder Jr. and introduced in his seminal 1978 book, “New Concepts in Technical Trading Systems.”1
Traditional interpretation and usage of the RSI are that values of 70 or above indicate that a security is becoming overbought or overvalued and may be primed for a trend reversal or corrective pullback in price. An RSI reading of 30 or below indicates an oversold or undervalued condition.
Awesome Oscillator is developed by famous technical analyst and charting enthusiast Bill Williams. Awesome Oscillator (AO) is an indicator that is non-limiting oscillator, providing insight into the weakness or the strength of a stock. The Awesome Oscillator is used to measure market momentum and to affirm trends or to anticipate possible reversals. It does this by effectively comparing the recent market momentum, with the general momentum over a wider frame of reference.

Relative Volume & RSI PopThis is a basic idea/script designed to take a breakout trade by taking advantage of volume spikes when price/strength is extended (either long or short).
The script only utilises two indicators, the Relative Volume (RV) and the Relative Strength Index (RSI). The script allows the user to select a RSI value between 69 up to 100 for a long trade and between 35 down to 0 for short trade and then pair this with RV from 0 - 10. The period for both the RSI and RV can also be amended by the user but I found in most cases there was no benefit gained by changing away from normal "14" period lookback. The script typically only has small draw downs as the script is designed to exit the trade when the RSI returns back to "normalised" level, therefore the trades are generally quite short. The exit condition for a long trade is when RSI crosses back below 69 (which is why you cannot enter a long below this value) and for a short the, trade will close when RSI crosses back above 35 (which is why you cannot enter a short above this value). These exit values are locked.
By allowing RSI value to go all the way up to "100" on the long side and "0" on the short side this in effect is a way of eliminating the script from taking either longs or shorts if lets say you wanted to back test the script for long only spikes or short only spike. E.G. By setting RSI upper value to "75" the RV to "1" and RSI lower value to "0" then no short trades will not be taken in your back test as the RSI never really gets down to zero.
I put this together with meme stocks in mind and back tested it on day charts for AMC and then a few trending style stocks too. It typically worked best as long only and with RSI settings between 71 - 75 and RV at 1 or 1.5. I also found it had okay results on some lower 1hr timeframe futures markets and weekly time frames too (albeit trades were few and far between on weekly timeframe).
The beauty of such a basic script you could easily set up a trading view screener to look for these opportunities everyday and perhaps even add in an ADX filter on the screener to see if the trend is increasing. Then use this script to run a back test on the stocks that you've selected from the screener.

All in one [Liubam]Hey tradingviewers!
This is an All in one Indicator for those who can't add too many indicators on your charts. Inspired by ©LonesomeTheBlue "Indicators all in one" script. I found a lot of very interesting scripts on the public library and I decided to make a tool with some of the greatest IMO, adding some modifications to improve the indicators. With this tool you can plot 1 of 6 different indicators by selecting it from a drop-down list (on the indicator settings).
All the credit goes to it's respective owners (taggeds).
THIS INDICATOR INCLUDES:
1. Classic RSI with some OB/OS tools:
The relative strength index (RSI) is a popular momentum indicator displayed as an oscillator (a line graph that moves between two extremes) that measures the magnitude of recent price changes to evaluate overbought or oversold conditions, in other words it shows signals about bullish and bearish price momentum. I added some visual improvements to help you finding the OB/OS zones.
2. Classic CCI with some OB/OS tools.
The Commodity Channel Index (CCI) is a momentum-based oscillator used as market indicator to help determine market movements that may indicate buying or selling. Added some vistual improvements to the chart.
3. ADX and DMI oscillator with the keylevel coded by @console:
The Average Directional Index (ADX) is non-directional indicator used by some traders to determine the strength of a trend. When the ADX line is rising (Above the keylevel) trend strength is increasing, and the price moves in the direction of the trend whether up or down. Otherwise, low ADX (Below the keylevel) is usually a sign of accumulation or distribution (Range). Non-trending doesn't mean the price isn't moving. It may not be, but the price could also be making a trend change or is too volatile for a clear direction to be present.
Suggested settings of the keylevel is 23-25.... REMEMBER: The trend may be your friend.
4. MFI
The Money Flow Index (MFI) is a technical oscillator for identifying overbought or oversold signals in an asset. Unlike conventional oscillators such as the RSI, the Money Flow Index incorporates both price and volume data, as opposed to just price. It can also be used to spot divergences which warn of a trend change in price.
5. Stochastic:
A stochastic oscillator is range-bound, meaning it is always between 0 and 100. This makes it a useful indicator of overbought and oversold conditions. Traditionally, readings over 80 are considered in the overbought range, and readings under 20 are considered oversold. However, these are not always indicative of impending reversal; very strong trends can maintain overbought or oversold conditions for an extended period. Instead, traders should look to changes in the stochastic oscillator for clues about future trend shifts. I added some features for this popular indicator to show the stochastic crosses.
6. The famous Squeeze momentum Indicator made by @Lazybear:
This is derivate of John Carter's "TTM Squeeze" volatility indicator and its very strong when using with trending indicator such a ADX. Black line (or no-line) on the midline show that the market just entered a squeeze ( Bollinger Bands are with in Keltner Channel). This signifies low volatility , market preparing itself for an explosive move (up or down). Gray line signify "Squeeze release". Mr.Carter suggests waiting till the gray line after a blackline, and taking a position in the direction of the momentum (for ex., if momentum value is above zero, go long). Exit the position when the momentum changes.
------------------------------------------------------------------------------------------------------------------------------------------------------------------------------------------------------------------------------------------------
This script is source code protected, but you can add to your favorite list to use it. Also you can add twice to use 2 different indicators at the same time (E.g. Squeeze Momentum Indicator + ADX)
An additional indicator I made (MA Hunterz + InfoPanel) is needed to not miss good entry points.
Your valuable comment and feedback is much appreciated...
And remember indicators can be really helpfull but always use Price Action.

Comparison (Malaysia Index & Sector)This is just a simple tool for convenient to compare and showing a clear image of all sector and index in Malaysia. They are just in one indicator. From this indicator, you can predict momentum of each sector in Malaysia, which is currently in bull or bear trend.
STRUCTURE
In the setting, the first line with the option of the following index (Malaysia Index) :
1. FBMKLCI
2. FTSEMYX:FBMSCAP
3. FTSEMYX:FBMACE
4. FTSEMYX:FBM70
5. FTSEMYX:FBMT100
6. FTSEMYX:FBMFLG
7. FTSEMYX:FBMEMAS
8. FTSEMYX:FA40
9. FTSEMYX:FBMMSCS
10. FTSEMYX:FBMAPMYR
11. FTSEMYX:FBMMSCAP
The rest of lines is all of the following sector (Malaysia Sector):
1. Technology
2. Telecommunication
3. Health
4. Consumer Product
5. Industrial Product
6. Construction
7. Property
8. Plantation
9. Utilities
10. Transportation
11. Energy
12. REIT
13. Finance
The last line (Line 15) is provided for other stock/index which is not available in option to manually fill.
All sector and index price are smoothen by Moving Average (MA). The default moving average is Relative Moving Average (RMA) which is used in Relative Strength Index ( RSI ) Oscillator. But the range is different from RSI , it is from -100 to 100 instead of 0 to 100. In the end, result and interpretation are just the same as RSI . Green area indicates oversold area, while red area is overbought.
Other choice of Moving Averages are available to change.
The problem of putting all together is the script may take longer to process. It is just for convenient use.
Bottom-Up or Top-Down Invest?

Stochastic Money Flow IndexThe Stochastic Money Flow Index (or Stochastic MFI ), is a variation of the classic Stochastic RSI that uses the Money Flow Index (MFI) rather than the Relative Strength Index (RSI) in its calculation.
While the RSI focuses solely on price momentum, the MFI is a volume-weighted indicator, meaning it incorporates both price and volume data.
The Stochastic MFI is intended to provide a more precise and sensitive reading of the MFI by measuring the level of the MFI relative to its range over a specific period.
Settings
Stochastic Settings
%K Length : The number of periods used to calculate the Stochastic. (Default: 14)
%K Smoothing : The SMA length used to 'smooth' the %K line. (Default: 3)
%D Smoothing : The SMA length used to 'smooth' the %D line. (Default: 1)
Money Flow Index Settings
MFI Length : The number of periods used to calculate the Money Flow Index. (Default: 14)
MFI Source : The source used to calculate the Money Flow Index. (Default: close)
Additional Settings
Show Overbought/Oversold Gradients? : Toggle the display of overbought/oversold gradients. (Default: true)

Parameter Free RSI [InvestorUnknown]The Parameter Free RSI (PF-RSI) is an innovative adaptation of the traditional Relative Strength Index (RSI), a widely used momentum oscillator that measures the speed and change of price movements. Unlike the standard RSI, which relies on a fixed lookback period (typically 14), the PF-RSI dynamically adjusts its calculation length based on real-time market conditions. By incorporating volatility and the RSI's deviation from its midpoint (50), this indicator aims to provide a more responsive and adaptable tool for identifying overbought/oversold conditions, trend shifts, and momentum changes. This adaptability makes it particularly valuable for traders navigating diverse market environments, from trending to ranging conditions.
PF-RSI offers a suite of customizable features, including dynamic length variants, smoothing options, visualization tools, and alert conditions.
Key Features
1. Dynamic RSI Length Calculation
The cornerstone of the PF-RSI is its ability to adjust the RSI calculation period dynamically, eliminating the need for a static parameter. The length is computed using two primary factors:
Volatility: Measured via the standard deviation of past RSI values.
Distance from Midpoint: The absolute deviation of the RSI from 50, reflecting the strength of bullish or bearish momentum.
The indicator offers three variants for calculating this dynamic length, allowing users to tailor its responsiveness:
Variant I (Aggressive): Increases the length dramatically based on volatility and a nonlinear scaling of the distance from 50. Ideal for traders seeking highly sensitive signals in fast-moving markets.
Variant II (Moderate): Combines volatility with a scaled distance from 50, using a less aggressive adjustment. Strikes a balance between responsiveness and stability, suitable for most trading scenarios.
Variant III (Conservative): Applies a linear combination of volatility and raw distance from 50. Offers a stable, less reactive length adjustment for traders prioritizing consistency.
// Function that returns a dynamic RSI length based on past RSI values
// The idea is to make the RSI length adaptive using volatility (stdev) and distance from the RSI midpoint (50)
// Different "variant" options control how aggressively the length changes
parameter_free_length(free_rsi, variant) =>
len = switch variant
// Variant I: Most aggressive adaptation
// Uses standard deviation scaled by a nonlinear factor of distance from 50
// Also adds another distance-based term to increase length more dramatically
"I" => math.ceil(
ta.stdev(free_rsi, math.ceil(free_rsi)) *
math.pow(1 + (math.ceil(math.abs(50 - (free_rsi - 50))) / 100), 2)
) +
(
math.ceil(math.abs(free_rsi - 50)) *
(1 + (math.ceil(math.abs(50 - (free_rsi - 50))) / 100))
)
// Variant II: Moderate adaptation
// Adds the standard deviation and a distance-based scaling term (less nonlinear)
"II" => math.ceil(
ta.stdev(free_rsi, math.ceil(free_rsi)) +
(
math.ceil(math.abs(free_rsi - 50)) *
(1 + (math.ceil(math.abs(50 - (free_rsi - 50))) / 100))
)
)
// Variant III: Least aggressive adaptation
// Simply adds standard deviation and raw distance from 50 (linear scaling)
"III" => math.ceil(
ta.stdev(free_rsi, math.ceil(free_rsi)) +
math.ceil(math.abs(free_rsi - 50))
)
2. Smoothing Options
To refine the dynamic RSI and reduce noise, the PF-RSI provides smoothing capabilities:
Smoothing Toggle: Enable or disable smoothing of the dynamic length used for RSI.
Smoothing MA Type for RSI MA: Choose between SMA and EMA
Smoothing Length Options for RSI MA:
Full: Uses the entire calculated dynamic length.
Half: Applies half of the dynamic length for smoother output.
SQRT: Uses the square root of the dynamic length, offering a compromise between responsiveness and smoothness.
The smoothed RSI is complemented by a separate moving average (MA) of the RSI itself, further enhancing signal clarity.
3. Visualization Tools
The PF-RSI includes visualization options to help traders interpret market conditions at a glance.
Plots:
Dynamic RSI: Displayed as a white line, showing the adaptive RSI value.
RSI Moving Average: Plotted in yellow, providing a smoothed reference for trend and momentum analysis.
Dynamic Length: A secondary plot (in faint white) showing how the calculation period evolves over time.
Histogram: Represents the RSI’s position relative to 50, with color gradients.
Fill Area: The space between the RSI and its MA is filled with a gradient (green for RSI > MA, red for RSI < MA), highlighting momentum shifts.
Customizable bar colors on the price chart reflect trend and momentum:
Trend (Raw RSI): Green (RSI > 50), Red (RSI < 50).
Trend (RSI MA): Green (MA > 50), Red (MA < 50).
Trend (Raw RSI) + Momentum: Adds momentum shading (lighter green/red when RSI and MA diverge).
Trend (RSI MA) + Momentum: Similar, but based on the MA’s trend.
Momentum: Green (RSI > MA), Red (RSI < MA).
Off: Disables bar coloring.
Intrabar Updating: Optional real-time updates within each bar for enhanced responsiveness.
4. Alerts
The PF-RSI supports customizable alerts to keep traders informed of key events.
Trend Alerts:
Raw RSI: Triggers when the RSI crosses above (uptrend) or below (downtrend) 50.
RSI MA: Triggers when the moving average crosses 50.
Off: Disables trend alerts.
Momentum Alerts:
Triggers when the RSI crosses its moving average, indicating rising (RSI > MA) or declining (RSI < MA) momentum.
Alerts are fired once per bar close, with descriptive messages including the ticker symbol (e.g., " Uptrend on: AAPL").
How It Works
The PF-RSI operates in a multi-step process:
Initialization
On the first run, it calculates a standard RSI with a 14-period length to seed the dynamic calculation.
Dynamic Length Computation
Once seeded, the indicator switches to a dynamic length based on the selected variant, factoring in volatility and distance from 50.
If smoothing is enabled, the length is further refined using an SMA.
RSI Calculation
The adaptive RSI is computed using the dynamic length, ensuring it reflects current market conditions.
Moving Average
A separate MA (SMA or EMA) is applied to the RSI, with a length derived from the dynamic length (Full, Half, or SQRT).
Visualization and Alerts
The results are plotted, and alerts are triggered based on user settings.
This adaptive approach minimizes lag in fast markets and reduces false signals in choppy conditions, offering a significant edge over fixed-period RSI implementations.
Why Use PF-RSI?
The Parameter Free RSI stands out by eliminating the guesswork of selecting an RSI period. Its dynamic length adjusts to market volatility and momentum, providing timely signals without manual tweaking.

Futuristic Indicator v3 - Enhanced Glow & Strength MetersTo ensure candles are display by script go to trading view settings and uncheck default Candle, Body and Wick to prevent them from plotting over your modified candles.
Futuristic Indicator v3 - Enhanced Glow & Strength Meters: Detailed Breakdown
This Modern styled Pine Script indicator is designed to enhance technical analysis by providing a visually striking OLED-style dashboard with multiple market insights. It integrates trend detection, momentum analysis, volatility tracking, and strength meters into a single, streamlined interface for traders.
1️⃣ Customizable Features for Flexibility
The indicator offers multiple user-configurable settings, allowing traders to adjust the display based on their trading strategy and preferences. Users can toggle elements such as strength meters, volatility indicators, trend arrows, moving averages, and buy/sell alerts. Additionally, background and candle colors can be customized for better readability.
🔹 Why is this useful?
Traders can customize their charts to focus on the data they care about.
Reduces chart clutter by allowing users to toggle features on or off.
2️⃣ Trend Detection Using EMAs
This indicator detects market trends using two Exponential Moving Averages (EMA):
A "Fast" EMA (shorter period) for quick trend shifts.
A "Slow" EMA (longer period) to confirm trends.
Comparison of the two EMAs determines if the trend is bullish (uptrend) or bearish (downtrend).
The indicator colors the trend lines accordingly and adds a trend arrow 📈📉 for quick visual cues.
🔹 Why is this useful?
EMA crossovers are widely used to identify trend reversals.
Provides clear visual cues for traders to confirm entry & exit points.
3️⃣ RSI-Based Momentum Analysis
The indicator integrates the Relative Strength Index (RSI) to gauge market momentum. The momentum value changes color dynamically based on whether it's in bullish (>50) or bearish (<50) territory.
🔹 Why is this useful?
RSI helps identify overbought and oversold conditions.
Detects trend strength by measuring the speed of price movements.
4️⃣ Bullish & Bearish Strength Meters
The indicator quantifies bullish and bearish market strength based on RSI and converts it into a percentage-based meter:
Bullish Strength (Long Strength)
Bearish Strength (Short Strength)
Strength meters are displayed using OLED-styled bars, dynamically changing in real-time.
🔹 Why is this useful?
Allows traders to visually gauge market sentiment at a glance.
Helps confirm if a trend has strong momentum or is losing strength.
5️⃣ Market Volatility Indicator (ATR-Based)
The indicator includes a volatility tracker using the Average True Range (ATR):
ATR is scaled up to provide easier readability.
Higher ATR values indicate higher market volatility.
🔹 Why is this useful?
Helps traders identify potential breakout or consolidation phases.
Allows better risk management by understanding price fluctuations.
6️⃣ Trend Strength Calculation
The indicator calculates trend strength based on the difference between the EMAs:
A higher trend strength value suggests a stronger directional trend.
Displayed as a percentage for better clarity.
🔹 Why is this useful?
Helps traders differentiate between strong and weak trends.
Reduces the likelihood of entering weak or choppy markets.
7️⃣ OLED-Style Dashboard for Market Data
A futuristic OLED-styled table is used to display critical market data in a visually appealing way:
Trend direction (Bullish/Bearish with an arrow 📈📉).
Current price.
Momentum value.
Strength meters (Bullish/Bearish).
Trend strength percentage.
Volatility Meter
The dashboard uses high-contrast colors and neon glow effects, making it easier to read against dark backgrounds.
🔹 Why is this useful?
Provides a centralized view of key trading metrics.
Eliminates the need to manually calculate trend strength.
8️⃣ Modern Style Neon Glow Effects
To enhance visibility, the indicator applies glowing effects to:
Moving Averages (EMAs): Highlighted with layered glow effects.
Candlesticks: Borders and wicks dynamically change color based on trend direction.
🔹 Why is this useful?
Improves readability in low-contrast or dark-mode charts.
Helps traders spot trends faster without reading numerical data.
9️⃣ Automated Buy & Sell Alerts
The script triggers alerts when momentum crosses key levels:
Above 55 → Potential Long Setup
Below 45 → Potential Short Setup.
🔹 Why is this useful?
Alerts help traders react quickly without constantly monitoring the chart.
Reduces the risk of missing critical trade opportunities.
🔹 Final Summary: Why is This Indicator Useful?
This futuristic cyberpunk-styled trading tool enhances traditional market analysis by combining technical indicators with high-visibility visuals.
🔹 Key Benefits:
✅ Customizable Display – Toggle elements based on trading needs.
✅ Trend Detection – EMAs highlight uptrends & downtrends.
✅ Momentum Tracking – RSI-based momentum gauge identifies strong moves.
✅ Strength Meters – Bullish/Bearish power is clearly visualized.
✅ Volatility Insights – ATR-based metric highlights market turbulence.
✅ Trend Strength Analysis – Quantifies trend intensity.
✅ Dashboard – Provides a centralized, easy-to-read data panel.
✅ Cyberpunk Neon Glow – Enhances clarity with stylish aesthetics.
✅ Real-Time Alerts – Helps traders react to key opportunities.
This indicator is designed to be both functional and visually appealing, making market analysis more intuitive and efficient. 🚀
